Documentation
Project
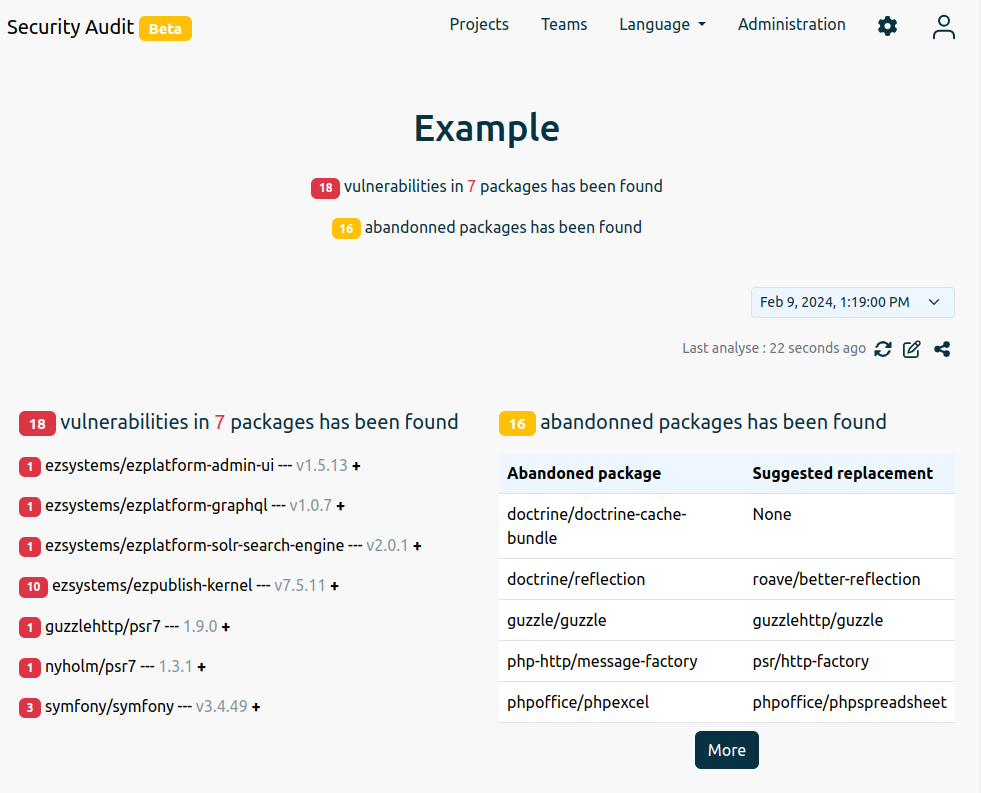
Here is an example of an analyzed project. This has two tabs.
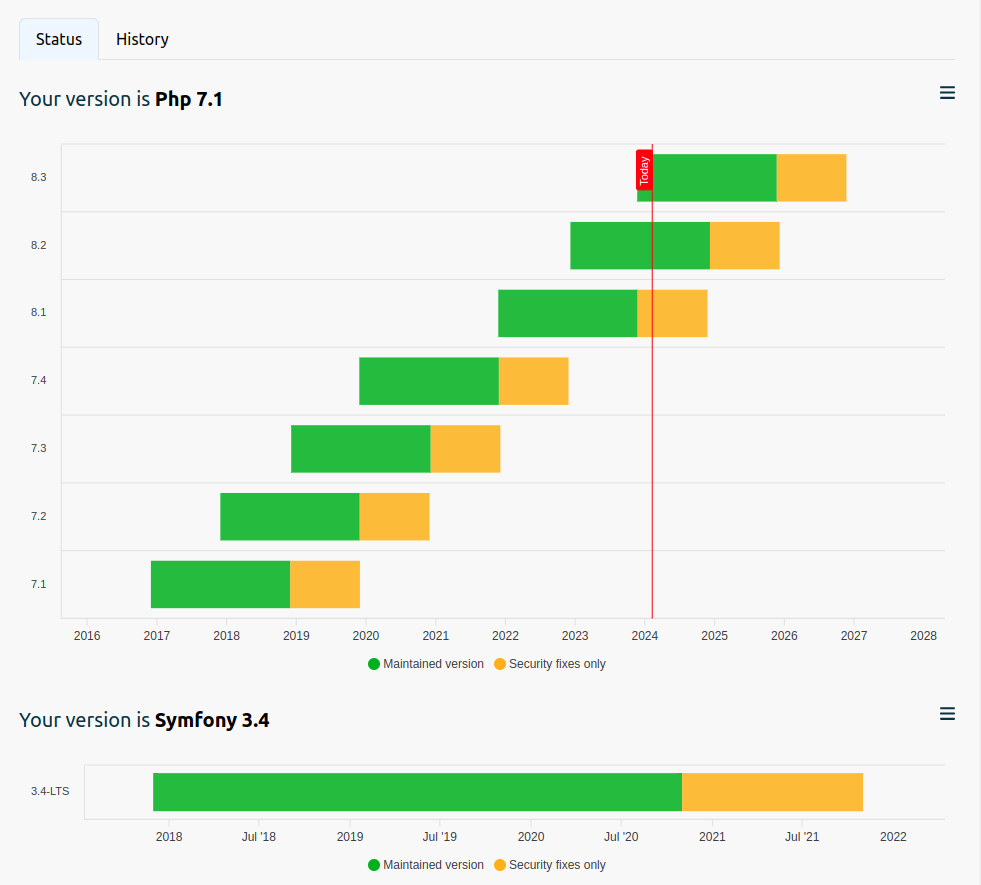
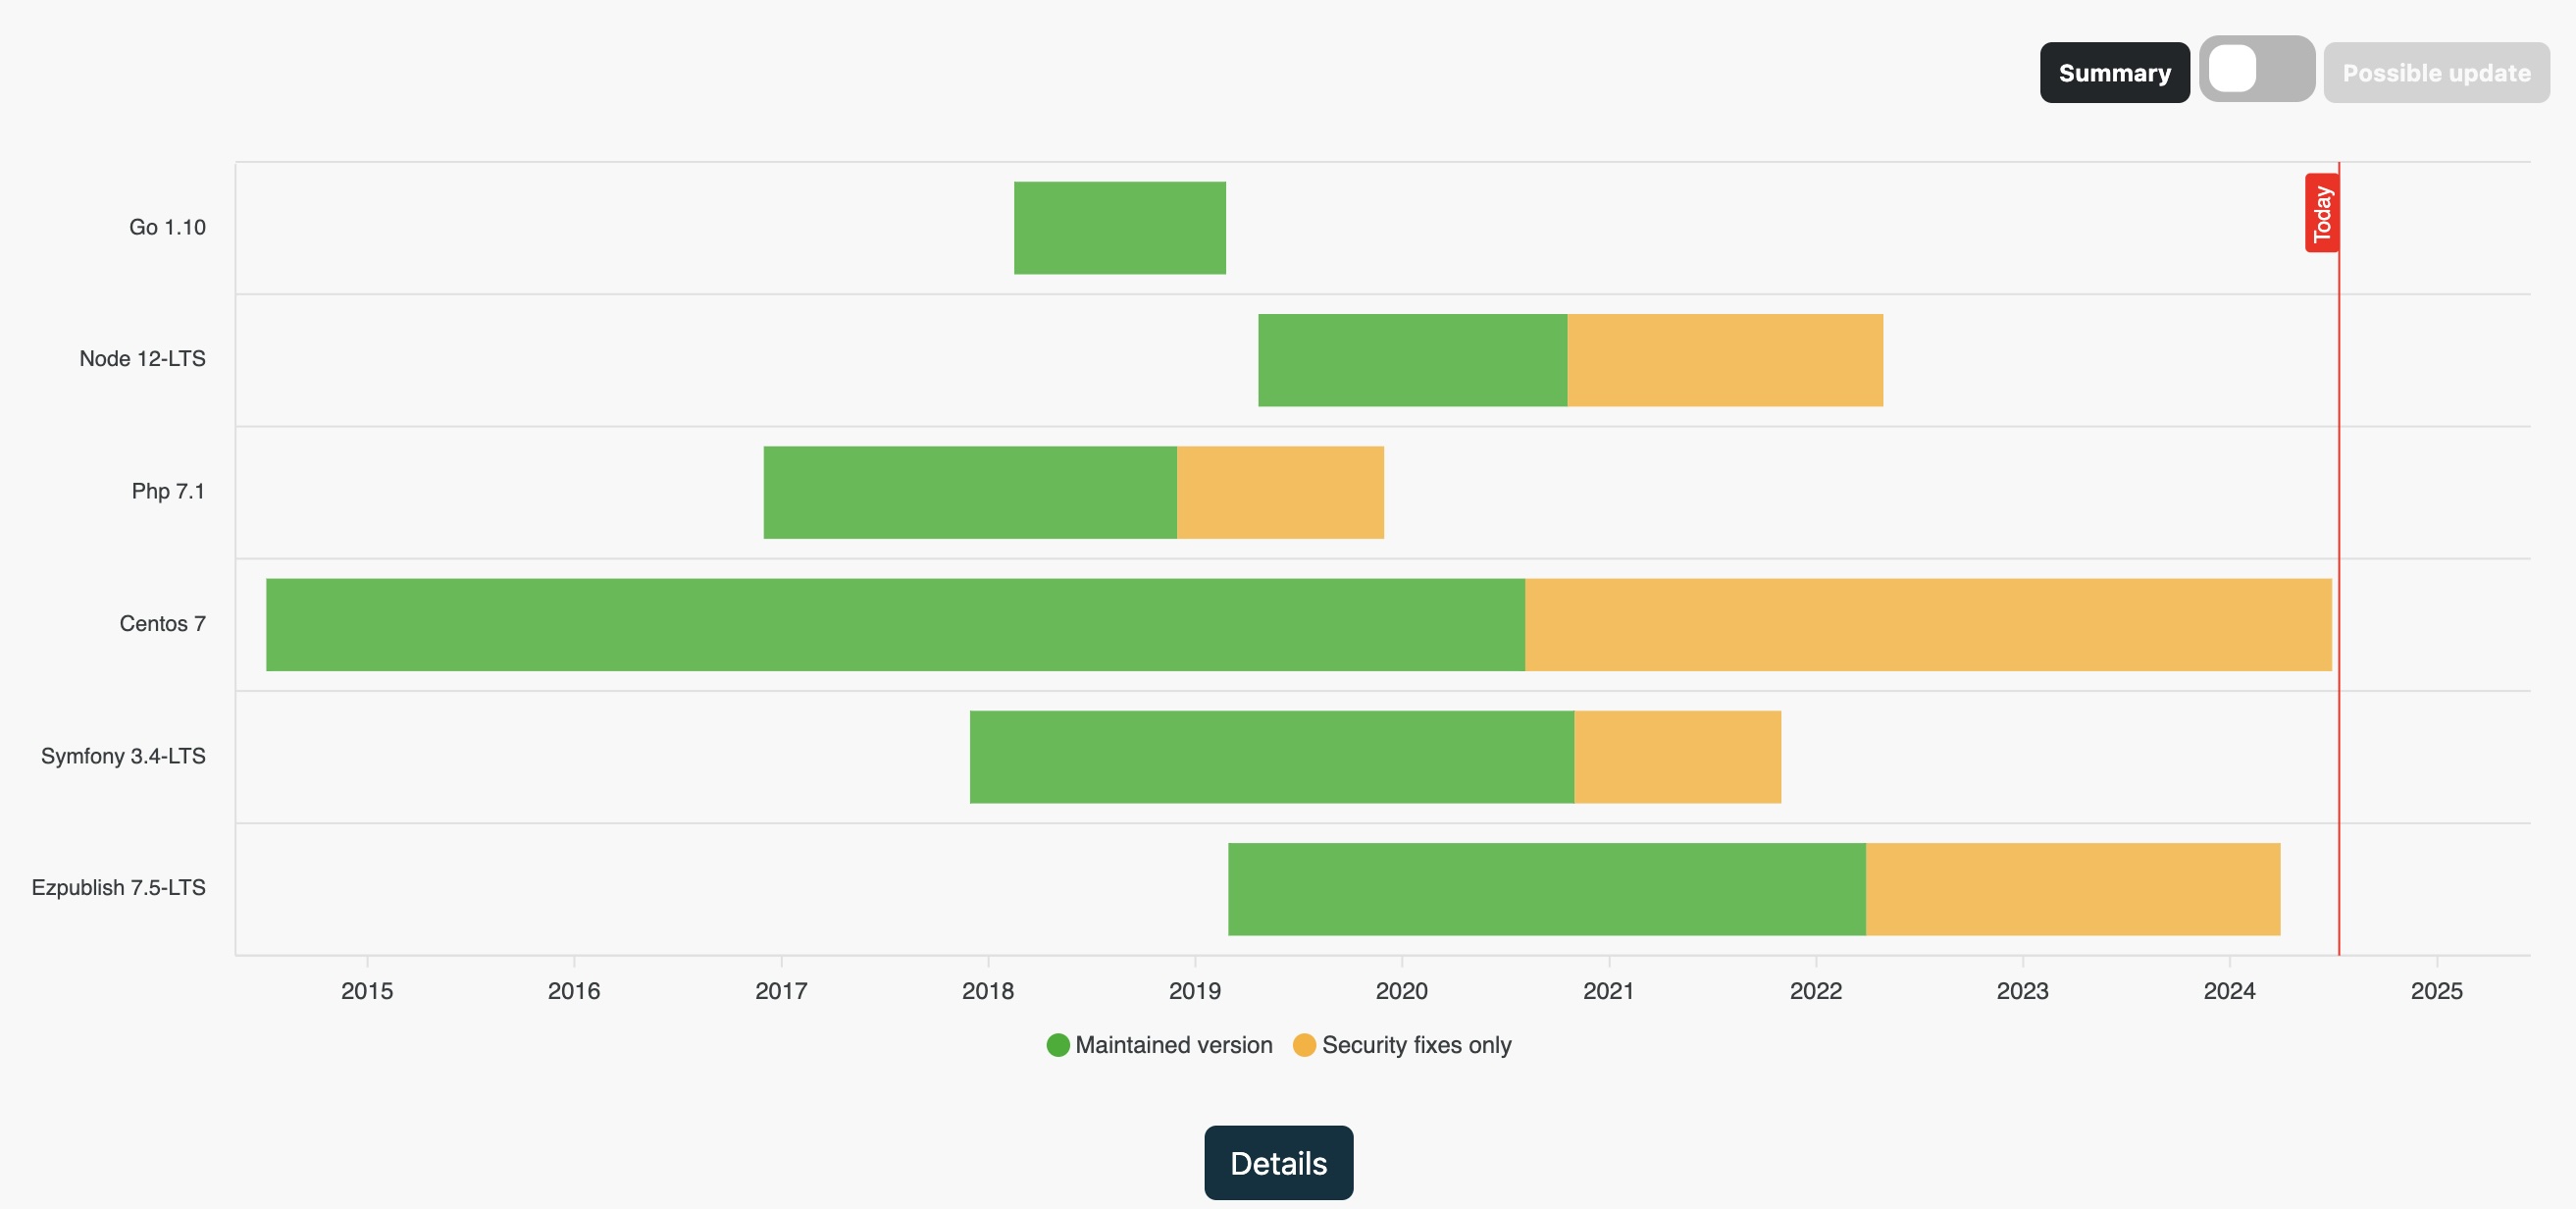
Status
The first 'Status' allows you to have an overall vision of the different services of your project. It is possible to sort the services with the icon available at the top right of each graph.
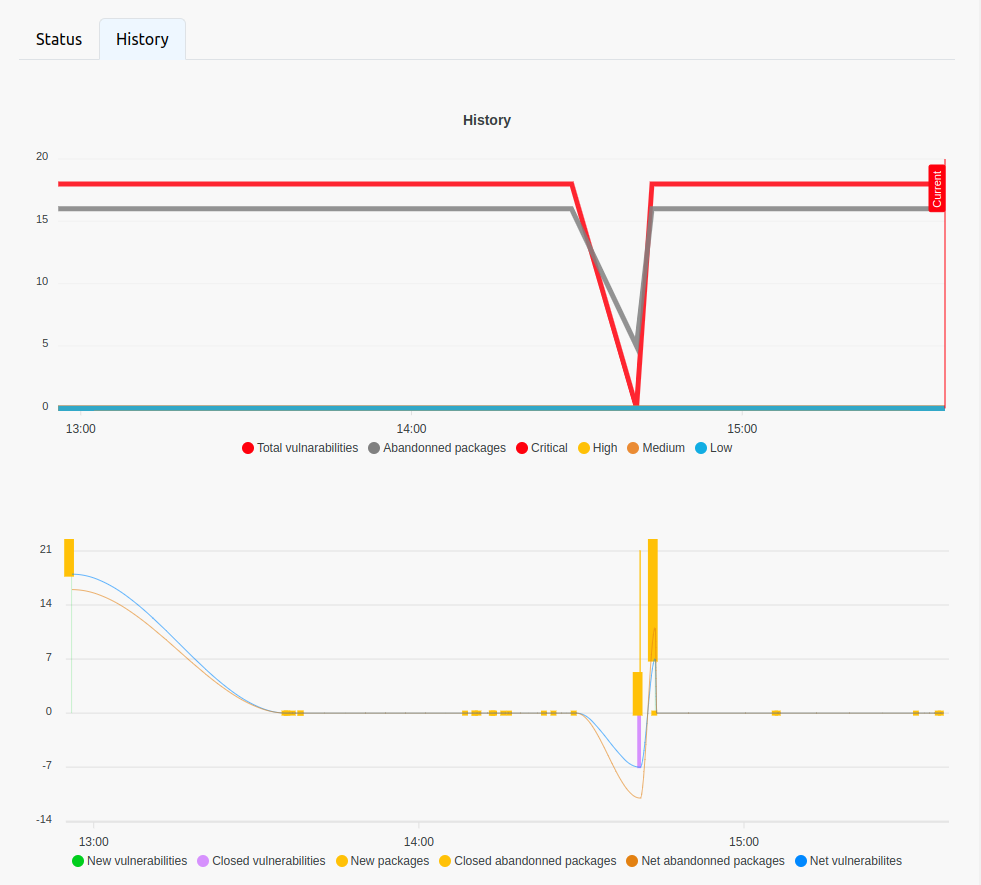
History
The second 'History' allows you to have the history of vulnerabilities and dropped packages on all analyses.
It is possible to display an old analysis by selecting the desired date from the list. Only old vulnerabilities and old abandoned packages will be shown. The services are not logged.
Services
It is possible to add external services to track them. To do this, you must modify the project and add the desired services.
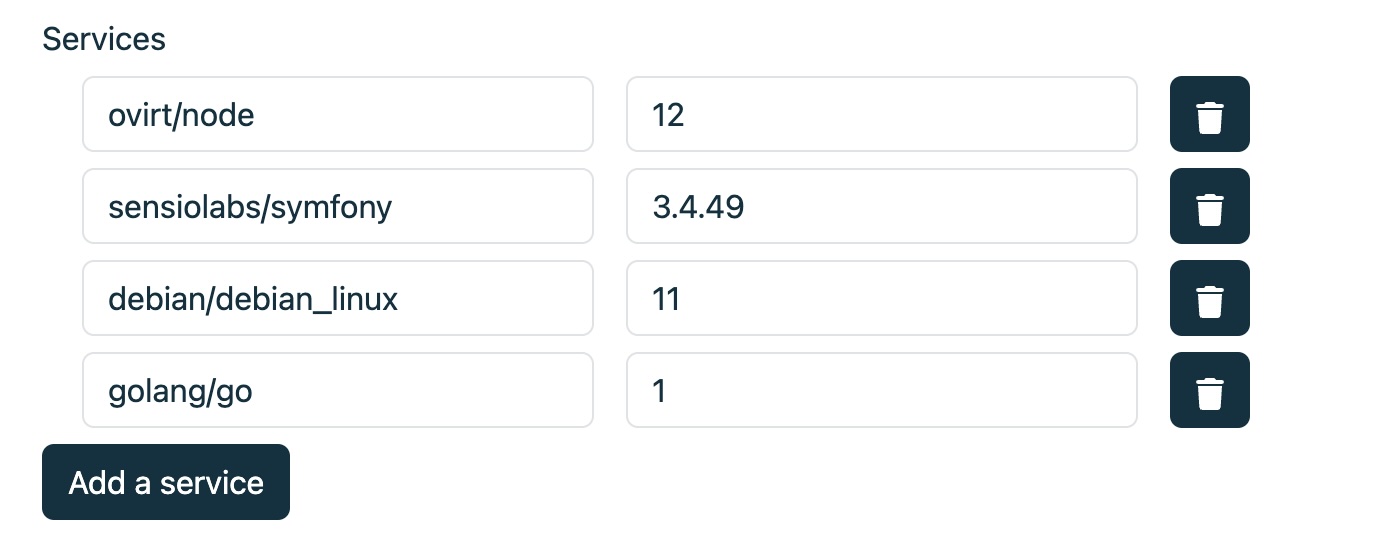
The status of the different services will be searched on the EndOfLife application
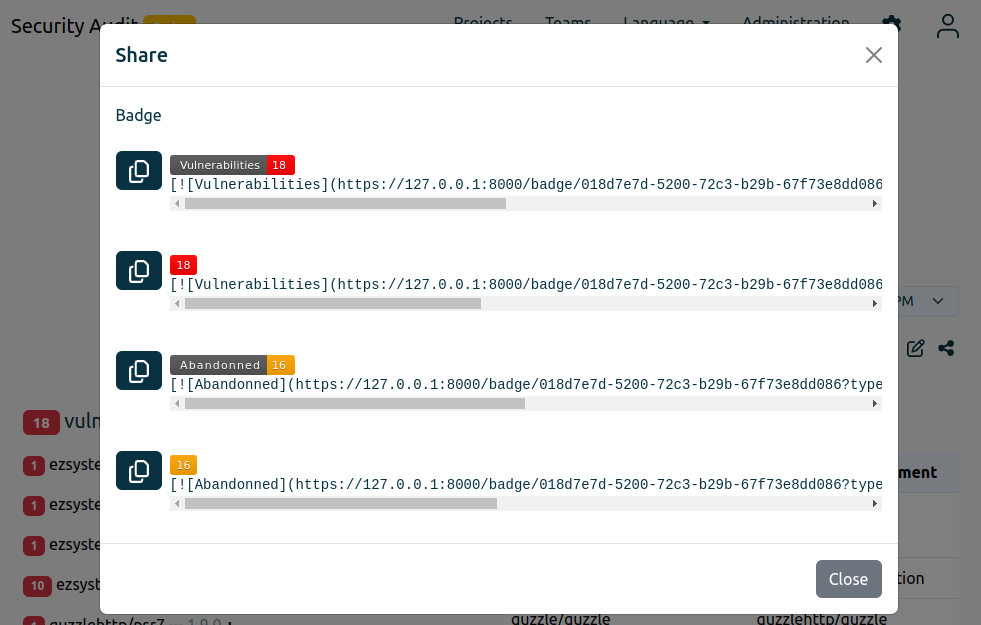
Badges
It is possible to add badges to track the status of your projects outside of the application.
Analysis
An analysis is launched automatically every day. You can manually start a new scan, but you are limited to one scan every 5 minutes. When the analysis is started manually, no notification will be sent by email.